
In this article, originally published in June 2011, Legacy.com founder Stopher Bartol examines the recurring phenomenon of higher death rates in winter months. The article has been updated to reflect current statistics.
Since founding Legacy.com in 1998, I have noticed that the winter months are busier than the summer months. Our newspaper and funeral home partners send us a higher volume of obituaries in December and January than they do in June and July. Anecdotally, many funeral directors I’ve spoken to over the years have told me the wintry months are especially busy times in their profession.
People outside the obituary and funeral industries are also beginning to notice. I was recently asked to weigh in for a Wall Street Journal article investigating why death doesn’t take a holiday but rather seems to work overtime around Christmas and New Year’s. The piece cited research by sociologist David Phillips, who examined 57.5 million U.S. death certificates from 1979 through 2004 and found a recurring rise in deaths during a two-week span beginning on Christmas.
It’s undoubtedly fascinating to discover trends related to death rates. After all, death is something that affects each of us. At Legacy, though, we find it more fascinating to think about the life behind each obituary. Indeed, our company is more about life than it is about death; we strive to be the place where life stories live on, and to help people share memories and preserve legacies as they mourn the loss of a friend or loved one.
In the process, however, we do learn a lot about death trends and statistics, and I don’t mind sharing it for those who are interested.
As we’ve known for years, there are seasonal fluctuations in U.S. deaths. People’s chances of dying in the winter months are significantly greater than in the summer. This is a statistical fact. It is generally true regardless of where they live in the U.S., and it is borne out year after year.
Number of Monthly Deaths in the U.S. from 1980 – 2017
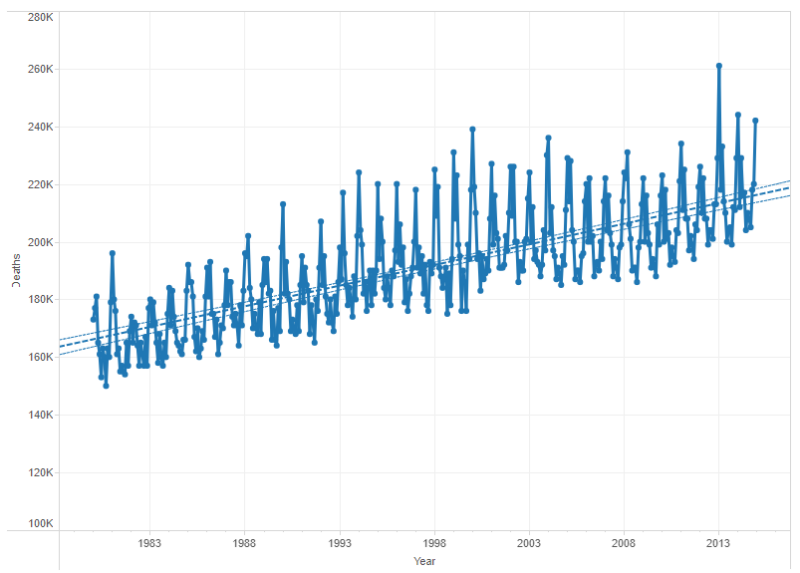
The above chart shows how consistent this pattern is from 1980-2014. The blue line plots monthly deaths as measured by the y-axis, starting with about 173,000 in January 1980. They show an unbroken pattern of deaths peaking in the winter and bottoming in the summer.
Drawing on a rich assortment of government data, we can do more than analyze past data; we can also build a predictive model to help understand how the average number of deaths is likely to rise or fall in a given month. By finding the average number of deaths that occur in a given month (for example, the number of total deaths occurring in July divided by number of years) and comparing that to the total average number of deaths per month (total deaths from 1980-2014 divided by total number of months), we can see how many deaths generally occur in that month relative to other months.
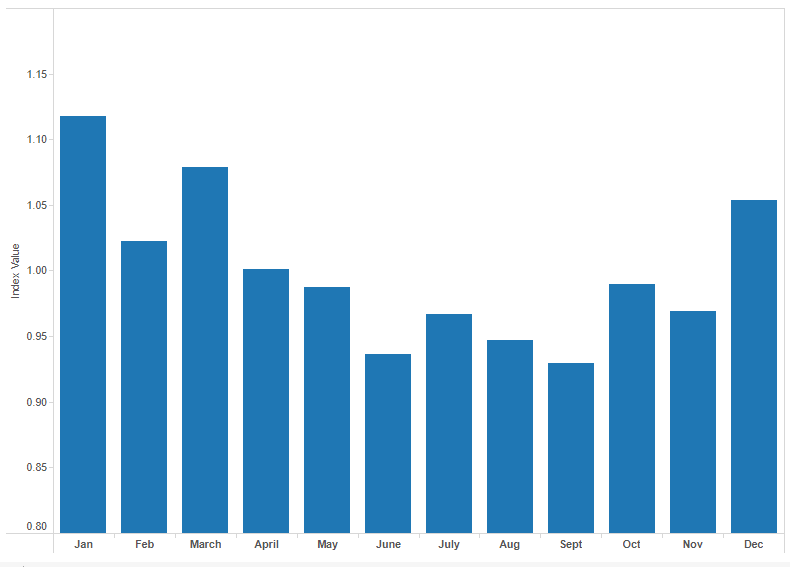
For instance, in the graph below, April has an index value of 1.0013. This means that the average number of deaths that occurred in April from 1980-2014 is very close to the total average number of deaths per month. The graph also shows that January has the highest index, at 1.1177, while September has the lowest index, at 0.9298. This means that on average, from 1980-2017, the greatest number of deaths occur in January while the least number of deaths occur in September.
Monthly Deaths from 1980 – 2017, Indexed by Average
Our analysis revealed that many causes of death in the U.S. exhibit seasonality in a “U”-shaped pattern, with the most deaths in the winter and the fewest in the summer. Why is this important? Because those who serve the needs of people experiencing the death of a friend or loved one should be aware that their services will typically be in greater demand in December, January, and March than in June, August, and September, and they must prepare accordingly. For example, if a newspaper picks one month to run public service announcements telling their readers about the obituary services they provide, they probably want that month to be sometime in late fall or winter when deaths are on their seasonal rise, so people will hear their message in advance of most needing to avail themselves of their services.
Is this seasonality experienced in every region of the U.S.?
Are different regions of the country, with milder seasonal weather fluctuations, immune to the overall seasonal death trend? A deeper dive into data from specific states tells us probably not. In fact, this seasonal pattern of deaths by month is the same in California, Florida, Illinois, New York, Pennsylvania, and Texas.
It is important to note that this does not mean that every single locale across the country will experience similar monthly patterns. In any given market, the smaller the population size, the greater the variability it might see, and the greater the likelihood that the seasonal pattern in any given year could deviate from the nationwide or statewide trend. But overall, this seasonality is a well entrenched phenomenon.
What causes such seasonality?
Once people become aware that death has a bias toward winter, some speculate they know one reason why: suicide. After all, it is the dark, cold nights of winter that push people “over the edge,” or perhaps holiday season blues. It turns out this is a myth. Suicide is actually one cause of death that has a slight bias toward summer. (And, it turns out, Mondays.) Facts are powerful things. Understanding such underlying drivers helps one appreciate the predictability of overall seasonal death trends.
If you analyze the monthly trends of the leading causes of death in the U.S. they can be divided into three groups, each with common characteristics:
Causes of Death, Grouped (%)
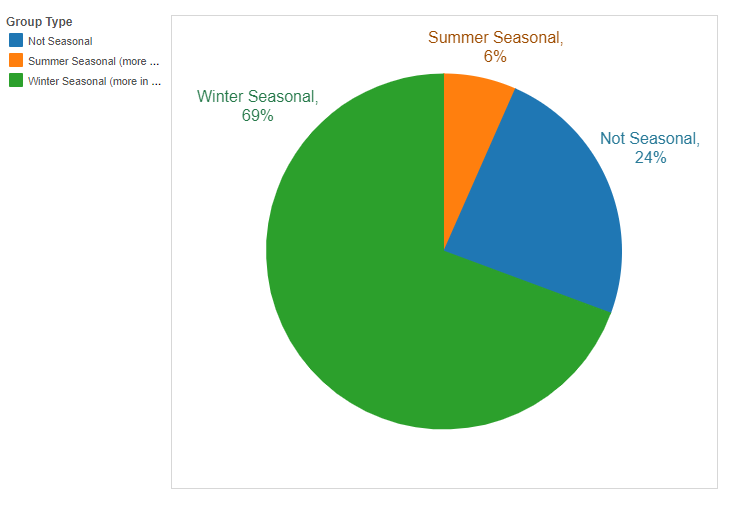
I won’t attempt to provide the medical explanation for the seasonal patterns of each cause of death, but we all know for example, that flu and pneumonia strike hardest in the winter months. This is the Winter Seasonal group.
Some causes of death do not exhibit any seasonality. These include cancer, homicides, and infant deaths — defined as Not Seasonal.
The third group are the kinds of death that occur more frequently in the summer, and less in the winter — that is, the Summer Seasonal deaths. These include suicide and accidents. (It might seem counter-intuitive that accidents aren’t more deadly in the icy winter months, but remember that many parts of the country get little or no snow, while, nationwide, the summer months are when roads fill with heightened numbers of drivers.) This represents the smallest number of deaths: just 6% of the total.
Taken together, death overall appears to be seasonal with a bias toward winter because a greater number of causes of death are seasonal. The Winter Seasonal group makes up 69% of deaths in the United States, much greater than either the Not Seasonal or Summer Seasonal groups. We could spend more time investigating why certain conditions result in higher winter mortality, but this feels like a topic for a different blog, at another time, and by a different blogger than me. My goal here is to help all those out there who have debated whether or not more people die in January — they in fact do — and to raise a glass in the direction of Mr. Anthony Trollope, who implied that seasonal mortality drops measurably by about May 7th of each year. It turns out he had that generally right.
Let no man boast himself that he has got through the perils of winter till at least the seventh of May.
-Anthony Trollope, Doctor Thorpe 1858
Related to Death & Dying |
|---|
| What to Know About Near Death Experiences |
| 12 End-of-Life Signs and Symptoms |
| The Fives Stages of Grief |